Stocks at 52-Week High Today
Stock Market Guides is not a financial advisor. Our content is strictly educational and should not be considered financial advice.
The stocks below are at their 52-week high today according to our stock scanner. You can sort columns or add filters in order to fine-tune the scan results.
| TICKER | YESTERDAY'S LAST PRICE | ENTER UP TO | CHART | TRADE STRATEGY | WINS* | LOSSES* | WIN %* | ANNUALIZED RETURN | TRADE DURATION | VOLUME | MARKET CAP | SECTOR | EARNINGS OVERLAP | DIVIDEND OVERLAP | TIME ADDED |
|---|---|---|---|---|---|---|---|---|---|---|---|---|---|---|---|
$0 | $106.72 | At 52-Week High | IZOO IO ZO.OZ% I3OO.OI% | 3 months | 1,208,700 | $366,941M | Financial Services | Yes | No | 09/08/2026 9:30 AM EST | |||||
$0 | $522.66 | At 52-Week High | IZOO IO ZO.OZ% I3OO.OI% | 3 months | 11,118,744 | $338,669.1M | Technology | No | Yes | 09/08/2026 9:30 AM EST | |||||
$0 | $165.26 | At 52-Week High | IZOO IO ZO.OZ% I3OO.OI% | 3 months | 2,367,100 | $111,844.6M | Financial Services | Yes | No | 09/08/2026 9:30 AM EST | |||||
$0 | $79.17 | At 52-Week High | IZOO IO ZO.OZ% I3OO.OI% | 3 months | 1,611,400 | $59,373.2M | Basic Materials | No | Yes | 09/08/2026 9:30 AM EST | |||||
$0 | $264 | At 52-Week High | IZOO IO ZO.OZ% I3OO.OI% | 3 months | 1,197,800 | $44,074.9M | Healthcare | Yes | No | 09/08/2026 9:30 AM EST | |||||
$0 | $59.21 | At 52-Week High | IZOO IO ZO.OZ% I3OO.OI% | 3 months | 3,401,300 | $35,161.3M | Healthcare | No | No | 09/08/2026 9:30 AM EST | |||||
$0 | $10.73 | At 52-Week High | IZOO IO ZO.OZ% I3OO.OI% | 3 months | 636,100 | $31,125.6M | Financial Services | Yes | No | 09/08/2026 9:30 AM EST | |||||
$0 | $32.18 | At 52-Week High | IZOO IO ZO.OZ% I3OO.OI% | 3 months | 13,302,000 | $29,434.5M | Technology | No | Yes | 09/08/2026 9:30 AM EST | |||||
$0 | $14.31 | At 52-Week High | IZOO IO ZO.OZ% I3OO.OI% | 3 months | 26,022,700 | $23,157.5M | Industrials | No | No | 09/08/2026 9:30 AM EST | |||||
$0 | $34.47 | At 52-Week High | IZOO IO ZO.OZ% I3OO.OI% | 3 months | 2,420,300 | $15,365.6M | Financial Services | No | Yes | 09/08/2026 9:30 AM EST | |||||
*According to our backtests
How to Use Our Scanner for 52-Week High Stocks
The above list represents stocks that have 52-week highs today.
It's powered by our proprietary stock scanner, which searches once per day for stocks that have 52-week highs.
You can sort columns using the up and down arrows next to the column name. You can add filters for the column values by clicking the "Add Filter" button above the list of 52-week high stocks. This scanner is designed for active stock traders.
This video shows how to use our scanner:
Scanner Features that Require a Subscription
Our free scanner offers you the ability to find stocks that have 52-week highs, but you may need more than that to ensure you're making trades that have a true edge.
Our paid Stock Investing Service includes scanner features that are designed to offer you all the intelligence our research can offer. These are the scanner features you get if you pay for a subscription:
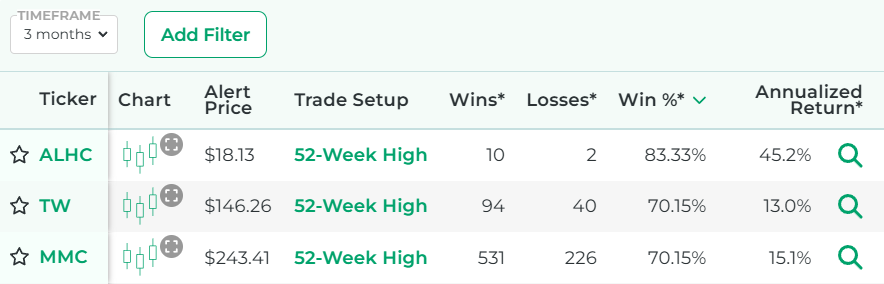
- See the historical backtested performance for each scan result. It looks like this:
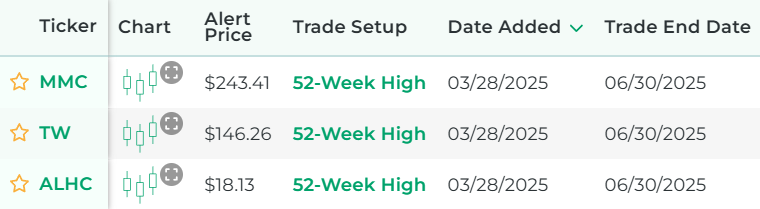
- See full trade setups for each scan result, including when to enter and exit. It looks like this:
- Get alerted when there are new scan results (by text or email).
- Get access to real-time scan updates throughout the trading day.
- Access scan results for all trading strategies in a single scan to easily see which trade setups have the best backtested performance across the entire market at any given time.
- Get access to scan results for our proprietary trading strategies, which required years of research to develop.
- Get stock picks that have a backtested edge
- Each pick has a signal with a 75%+ annualized return in backtests
- Get trade alerts with clear entry and exit details
Here's a video that explains the difference between our free 52-week high scanner and the scanner from our paid service:
Stock Market Guides

Get stock picks that have a backtested edge
Average Annualized Return?
43.1%
52-Week High Definition
There are 52 weeks in a year, and a stock’s 52-week high provides a point of reference about the price range of a stock over the last year.
As you look at the price activity of any stock, it can be helpful to see its range of price at any given time. It helps you understand how a stock’s current price relates to its performance over the last year.
Video About 52-Week High
For a visual walkthrough of how to identify a 52-week high on a daily stock chart, check out this video.
How We Find 52-Week High Stocks Each Day
Our one-of-a-kind scanning technology is at the heart of everything we do here. We have a way to program a trading strategy into our scanner, and then it uses real-time data feeds to find any stocks that meet the criteria of the trading strategy.
In the case of finding stocks that have 52-week highs each day, our scanner looks for stocks that just reached their highest price in the last year on the most recent trading day.
Our Criteria for Defining 52-Week High Stocks
To find stocks that have 52-week highs, our scanner looks for stocks where yesterday's stock closing price equated to the highest price in the last calendar year.
Other Popular Scans at Stock Market Guides
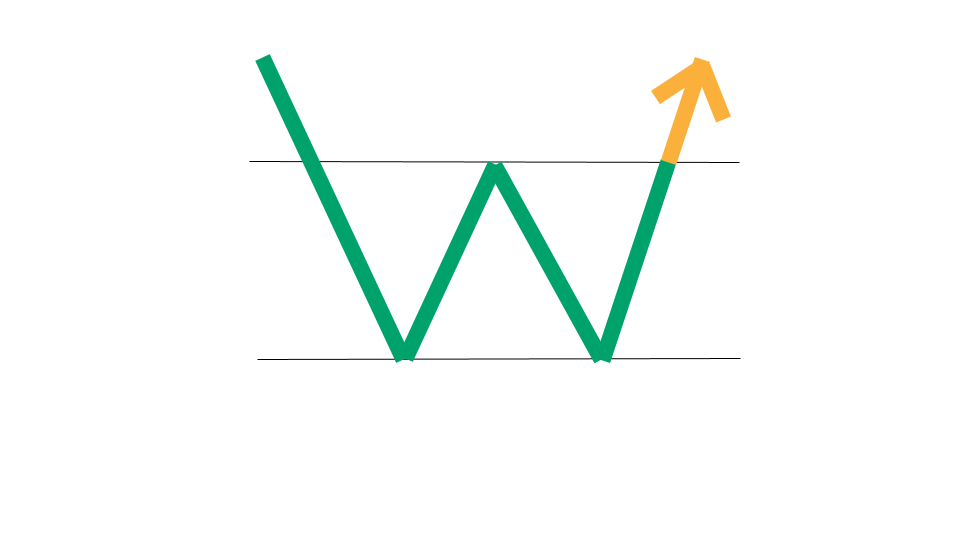
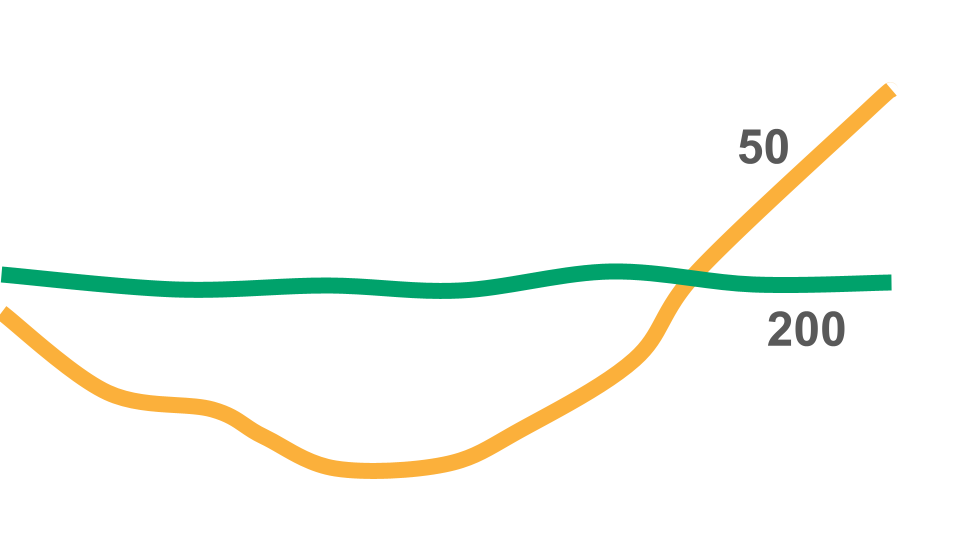
Want to see scans we have for other popular indicators, chart patterns, and candlestick patterns? Check them out here:

Have Questions About 52-Week High Stocks or Our Services?
If you have questions about stocks with 52-week highs or questions about any services we offer, you can contact us any time and we'll be ready to help.
Join Our Free Email List
Get emails from us about ways to potentially make money in the stock market.
Stock Market Guides
You can trade without an edge, but why?
What We Offer
Get stock picks that have a backtested edge
- Each pick has a signal with a 40%+ annualized return in backtests